Dashboard structure – quick overview
Dashboard Top Bar
Company Selection
Use the company selector to switch between customers and manage the correct environment. Always verify that you are working in the intended company before making changes.
Time Filter
The dashboard displays data based on the selected time period. Reports, detections, alerts, and statistics may vary depending on the active timeframe.
⚠️ Important:
Always verify the selected time period before reviewing alerts or statistics. Heimdal is a time-based system, so the displayed information depends on the active time filter.
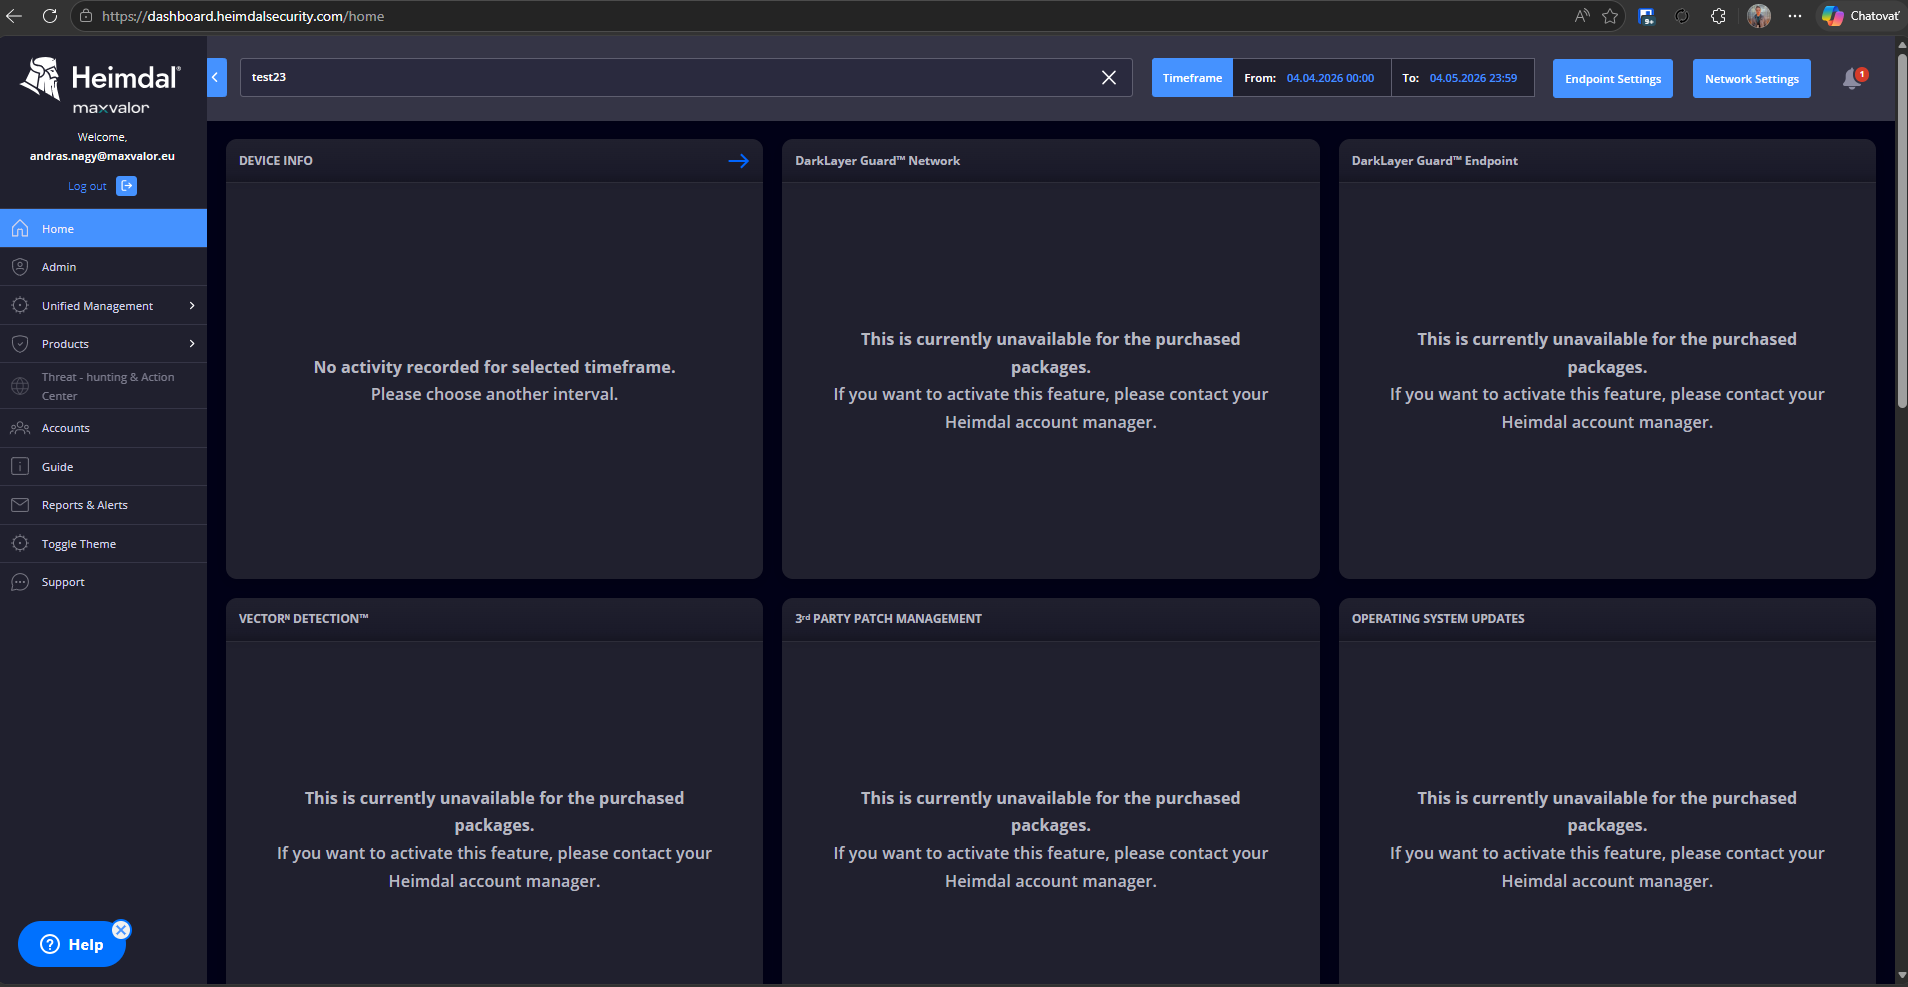
The Dashboard can be divided into three main parts:
- Left menu – navigation between functions
- Top bar – client selection, period selection
- Central content – graphs, statistics, events
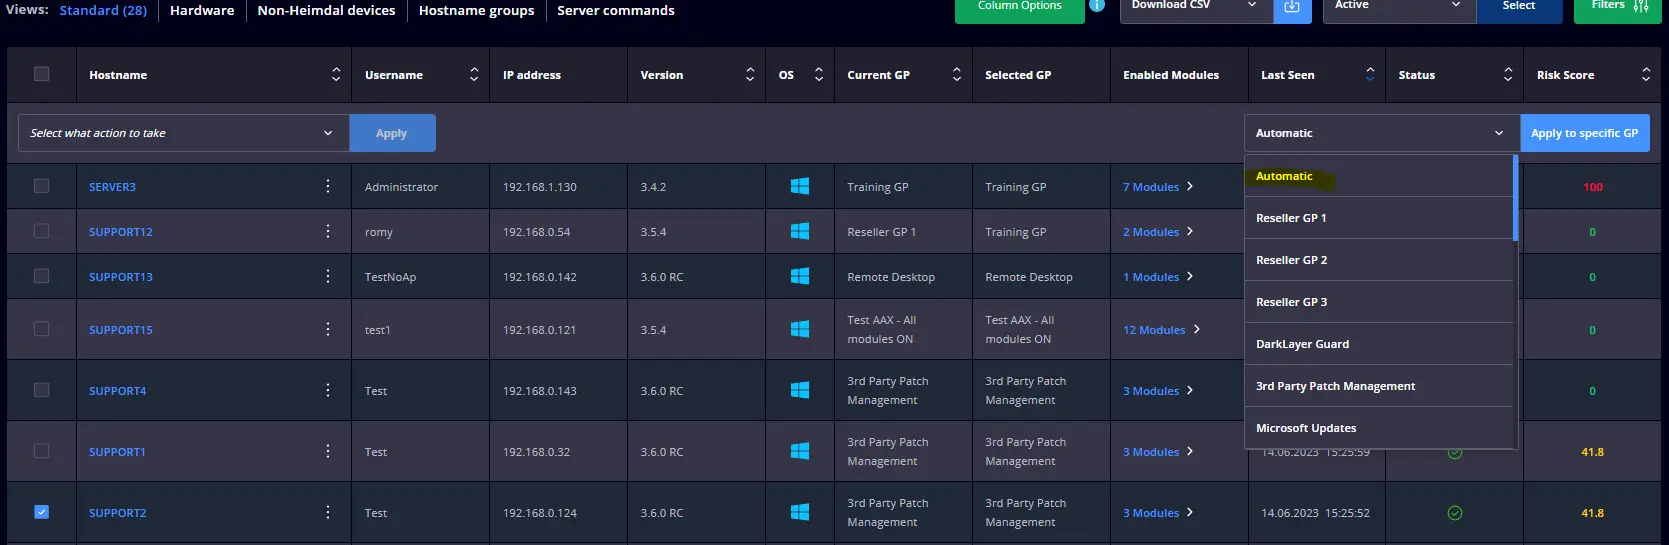
Endpoint Settings & Group Policy Concept
Endpoint Settings & Group Policies
Heimdal is a group policy-based system. Every endpoint belongs to a policy group, and its behavior is controlled by the settings configured in that policy.
Policy Priority Logic
Endpoints are automatically assigned to the highest relevant policy available.
Example:
- Policy 1 → Servers
- Policy 2 → Administrators
- Policy 3 → All Users
Result:
- Server → Policy 1
- Administrator workstation → Policy 2
- Standard user device → Policy 3
⚠️ Always review policy priority carefully, as higher-priority policies override more general configurations.
The Dashboard can be divided into three main parts:
- Left menu – navigation between functions
- Top bar – client selection, period selection
- Central content – graphs, statistics, events
Left menu – Navigation to main features
The Left-side menu is located on the left side of the Heimdal Dashboard, which is the primary navigation interface of the system. All main functions and modules are accessible from here, logically grouped together. In everyday use, this menu will be one of the most frequently used elements of the Dashboard.
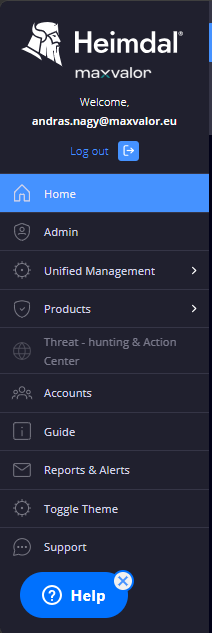 Home
Home
Home is the default home page that you are automatically taken to every time you log in. This page provides a quick, summary view of the security status of your entire environment. It displays graphs, statistics, and summaries for active Heimdal modules, allowing you to see at a glance whether your system is functioning properly and whether any security events have occurred during the period.
Unified Management
The Unified Management menu is the central management interface for devices and endpoints. This section contains Device Info, which displays devices with Heimdal Agent, their status, availability, and basic technical data. For example, you can check whether a device is active, when it was last accessed, and what Group Policy is applied to it. The goal of Unified Management is to make all information about endpoints available in one place.
Products
Detailed views of each Heimdal module are available under the Products menu. Each product – such as DNS Security, Next‑Gen Antivirus, Patch & Asset Management or Email Security – is displayed on a separate page, where you can see not only aggregated graphs, but also specific events, detections and action options. This is the area where most administrator intervention takes place.
Threat-hunting & Action Center
Threat-hunting & Action Center is an advanced security analytics platform that combines data from multiple Heimdal modules to help you analyze threats in more depth. This section is primarily used in environments where active incident management and detailed security analysis are required. It not only shows individual events, but also shows correlations and patterns.
Reports
The Reports menu is used to generate reports. From here, you can generate technical reports, executive (C-level) summaries, and various compliance reports, such as for NIS2 or Cyber Essentials purposes. Reports can be manually initiated or scheduled, making them suitable for regular internal reporting and audits.
Guide / Support
The Guide / Support section contains settings and information related to the Heimdal environment. This is where you can find license information, API keys, downloadable installers, and access the official Heimdal documentation and support interface. This menu item is mainly for configuration and informational purposes.
💡 Tip: Initially, it is best to focus on the Home, Unified Management, and Products menu items, as these will be most needed during daily operation. 💡
Agent Installation
IMPORTANT! Before installing the Agent on other machines, we recommend that you complete the GP settings first!
Downloading the Agent
The HEIMDAL Agent installer can be found in the Guide menu under:
Download and install
From here, you can download the appropriate installer for:
- Windows
- Ubuntu/Linux
Activation Process
Agent activation is performed using an Activation Key generated in the dashboard.
⚠️ Important:
The agent is connected to a company based on the assigned license and activation key. Always verify that the correct activation key is used before deployment.
Basic Installation Flow
- Open the Guide menu
- Select Download and install
- Download the required installer
- Run the installer on the endpoint
- Enter or apply the Activation Key
- The endpoint will automatically appear in the correct company dashboard after successful activation
Device Information
After a successful installation and activation, the endpoint will automatically appear in the dashboard under Device Info.
Administrators can review important endpoint details, including:
- Hardware information
- Operating system details
- Installed HEIMDAL Agent version
- IP address
- Logged-in user
- Last Seen timestamp
- Active policy assignment
The Last Seen field helps verify whether the endpoint is actively communicating with the HEIMDAL infrastructure. If a device has not checked in recently, network connectivity, agent status, or policy assignment should be reviewed.
⚠️ Important:
Newly installed agents may require a few minutes before all information is fully synchronized and displayed in the dashboard.
If you have any questions, please contact our product support team! [email protected]